
The New York Times Global Snapshot
NYT Global Snapshot
The New York Times Global Snapshot is an interactive news website I designed in Fall of 2016. The site geographically plots top stories on a responsive map page. The articles are sourced from The New York Times homepage, and plotted based on the story’s location. Users can hover each plot and see the article title and thumbnail. Clicking the plot point opens an article preview panel with the expanded information. At the bottom of the panel there is a button that sends users to the full story on The New York Times’ website. Once the article preview panel is collapsed, users can keep track of which article’s they’ve already viewed. Users can also navigate to the region of a headline by clicking a title in the sidebar*. The website allows users to efficiently explore world news in an exciting and easily digestible way.
The website was developed as a final project for the HCDE 310: Interactive Systems Design and Technology course. I worked with my classmate and friend Noah Eisfelder to design, iterate, and develop a solution for conveying world news in a streamlined manner that also visualizes geographic data. The website is based off of three APIs, the NYT Top Stories API, the Google GeoCoding API, and the Google Maps API - development was done in Python and JavaScript. After initially coming up with the idea for an interactive news map, I handled designing the UI of the website, testing the website with users, and refining the features of the site. Additionally, I wrote some of the Python code that pulled information from the NYT API.
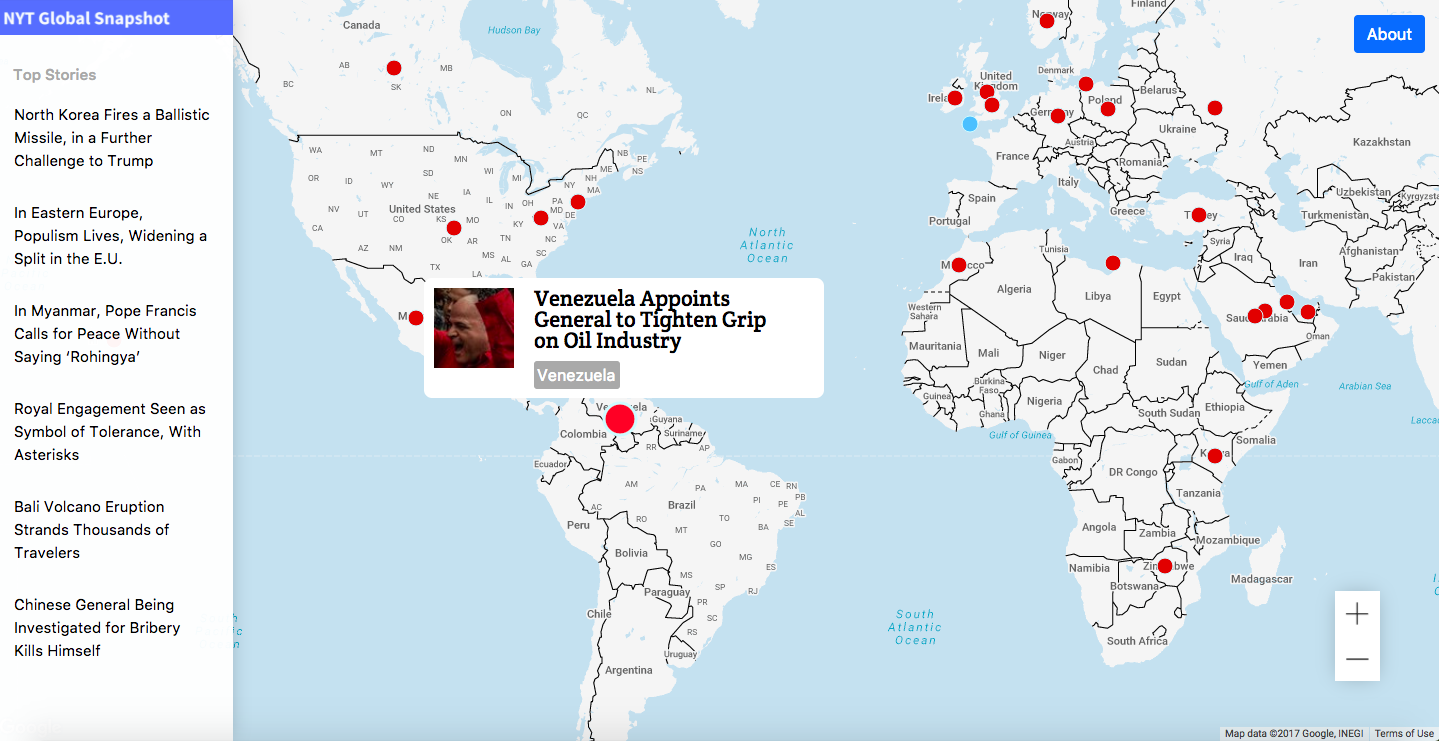
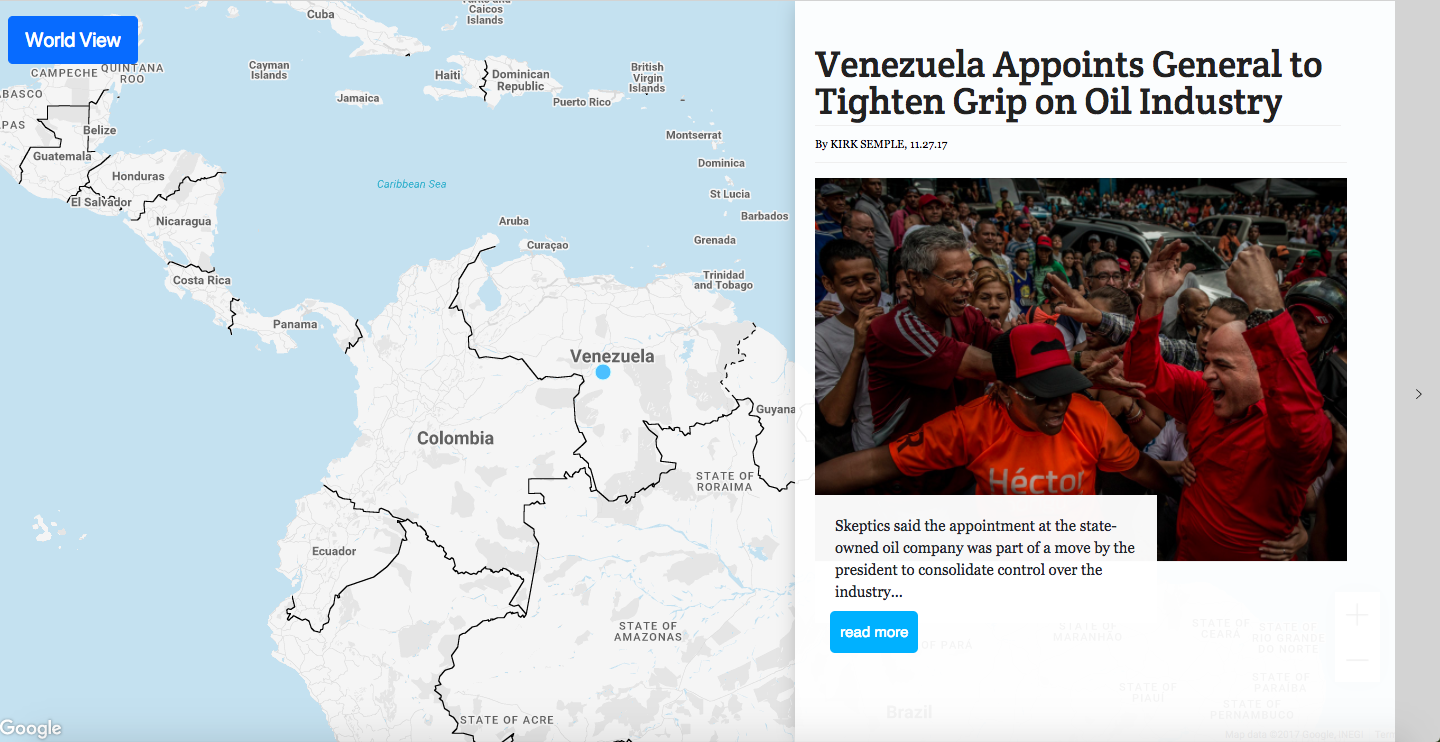
Screenshots from the NYT Global Snapshot Webpage
*Due to recent changes to the NYT API, this feature is currently unavailable, we will be launching an update soon!


